.png)
Prefer to watch? Here's this weekend's video update.
The Week in Review
The S&P 500 set a record this week. The Russell 2000 fell for the eighth week in a row. Both of those sentences are true at the same time, and the distance between them is the only thing on this tape worth your attention.
SPX closed at 7,811.51, up 1.15%. The Dow rose 0.93% to 51,655.01. The Nasdaq Composite added 0.64% to 27,366.17. The Russell 2000 fell 0.86% to 2,808.57 — its eighth consecutive weekly decline.
The records came Tuesday. SPX closed above 7,800 for the first time and touched 7,844 intraday, with the Nasdaq setting a record alongside it.
Wednesday interrupted it, and the interruption came from the bond market. The 30-year Treasury yield reached its highest level since 2002, closing at 5.66%, with the 10-year running near 5.31% intraday before settling at 5.24% by Friday. Equities pulled back, then steadied Thursday and Friday as yields and oil calmed. SPX added 0.59% Friday to finish about eight points under the record close.
The Fed Said One Thing. The Market Heard Another.
Wednesday brought the minutes from the September 15–16 meeting, and they contained something unusual. The vote to hike was unanimous — but the reasoning was not. A majority supported the move on “risk-management grounds.” A minority considered it outright “necessary.” And “most” participants said they expect another increase by year end.
Thursday, Governor Waller went further in public, saying he sees “additional hikes” — plural — though not necessarily at consecutive meetings.
The market responded by pricing less tightening, not more. October hike odds fell below 20%, with roughly 82% now priced for a pause at the October 27–28 meeting.
The interpretation is that the committee is talking hawkish to keep the long end honest while intending to sit still. That interpretation has been correct repeatedly this year. It is also the interpretation that leaves positioning with no protection if Wednesday's inflation number runs hot.
Weekly Market Scorecard — Week Ending October 9, 2026
| Index | Oct 2 Close | Oct 9 Close | Change | % Change |
|---|---|---|---|---|
| SPX | 7,722.72 | 7,811.51 | +88.79 | +1.15% ↑ |
| Dow | 51,176.96 | 51,655.01 | +478.05 | +0.93% ↑ |
| Nasdaq Composite | 27,190.86 | 27,366.17 | +175.31 | +0.64% ↑ |
| Russell 2000 | 2,832.89 | 2,808.57 | -24.32 | -0.86% ↓ |
The Nasdaq-100 finished the week essentially flat, just off Tuesday's record. Other closes: VIX 14.84, 10-year 5.24%, 30-year 5.66% (Wednesday's close, a 24-year high), crude $91.85, gold $4,216.30.
Breadth Is the Whole Story
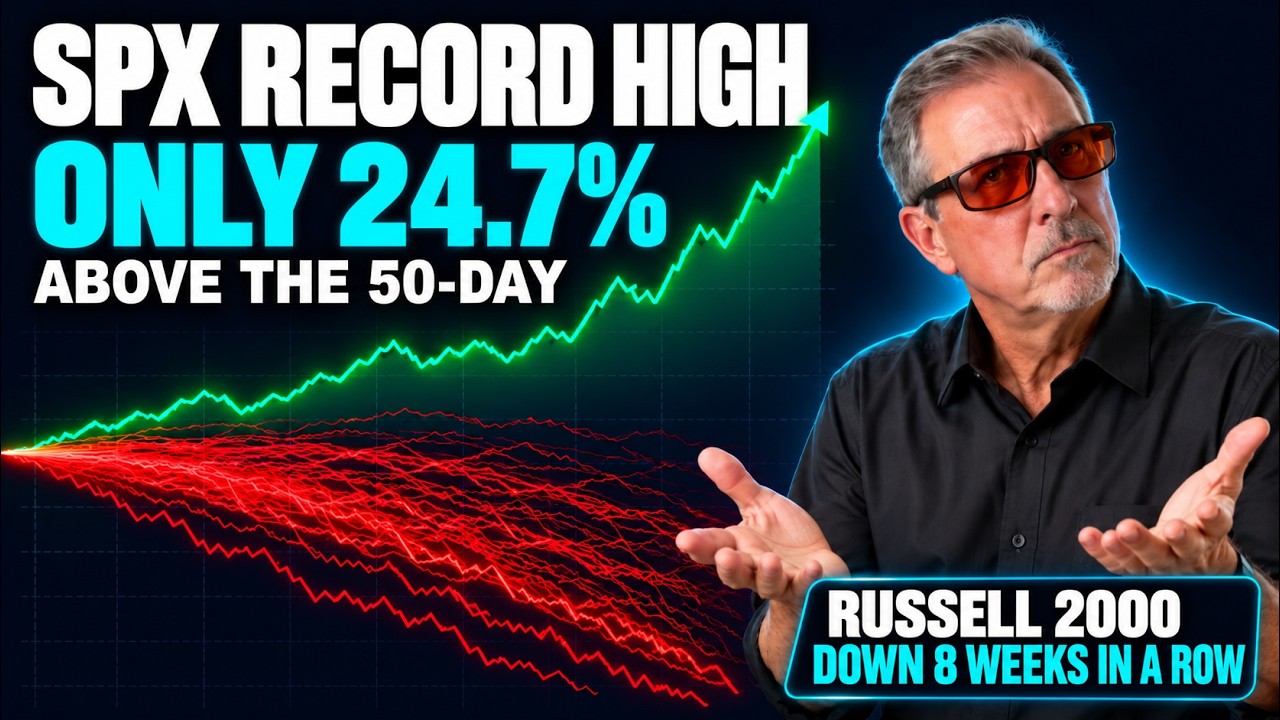
With the index at a record, only about one in four S&P 500 members is trading above its own 50-day moving average. On August 13 that figure was roughly 68%. Fewer than half the index is above its 200-day.
It is worth being careful about how this gets framed. Eight straight down weeks in the Russell 2000 is not rotation — rotation is money moving from one sector into another. This is one-directional decline across two thousand smaller companies while the long end of the curve sits at a 24-year high. That is a financing signal, not a preference signal. Small companies borrow. Large cash-rich companies do not need to.
Which is why the index can make a record while three quarters of it goes the other way.
SPX
7,811.51 on the close. The record close sits around 7,819, with Tuesday's intraday high at 7,844. Support at 7,722 — last Friday's close and the launch point for this move — then 7,700, then the 7,600 shelf. A break of 7,600 would be the first real structural damage. VIX closed at 14.84, back near the floor of its range.
Nasdaq / QQQ
The Composite rose 0.64% to 27,366.17. The Nasdaq-100 finished the week essentially flat, just off Tuesday's record. Large-cap technology with cash on the balance sheet remains the one group a 5.24% ten-year does not punish.
Russell 2000 / IWM
2,808.57, down 0.86%, the eighth consecutive weekly decline. The index is making lower lows and lower highs inside a well-defined downtrending channel. Small caps need cheap financing, and the long end keeps telling them it isn't coming.
Next Week's Economic Calendar — October 12 to 16
Monday October 12 — Columbus Day. Bond market closed, equity markets open. No economic data of consequence; thin liquidity.
Tuesday October 13 — NFIB Small Business Optimism (Sep). Bank earnings begin: JPMorgan, Goldman Sachs, Citigroup and Wells Fargo, all before the open.
Wednesday October 14 — CPI (Sep), 8:30 AM ET. Headline MoM prior +0.4%, consensus +0.6%; headline YoY prior 3.4%, consensus 3.6%; core MoM prior +0.3%, consensus +0.2%; core YoY prior 2.4%, consensus 2.5%. Also the Fed Beige Book at 2:00 PM ET and a Treasury buyback announcement.
Thursday October 15 — PPI (Sep), headline MoM consensus +0.5%; Retail Sales (Sep); initial jobless claims; Philadelphia Fed Manufacturing Index (Oct) — all at 8:30 AM ET.
Friday October 16 — Monthly options expiration. Industrial Production and Capacity Utilization; Export/Import Price Indexes.
Key watch: Wednesday's CPI, and specifically the split between headline and core. Core is forecast to improve — monthly +0.2% from +0.3%, which would be a genuinely encouraging number. Headline is forecast to accelerate — monthly +0.6% from +0.4%, annual 3.6% from 3.4%. That combination is energy and goods doing the damage while the Fed's preferred underlying measure cools.
In a normal cycle the market looks through it. This is not a normal cycle. The 30-year is at a 2002 high, “most” FOMC participants have already said they expect another hike, and a Fed governor used the word “hikes” on Thursday. A 3.6% headline hands the hawks a usable number regardless of what core does, and the first thing to reprice would be the long end — which is exactly what cracked the tape on Wednesday.
Thursday is the underrated day. PPI, Retail Sales, claims and Philly Fed all land at 8:30 simultaneously. Four releases in one minute means whichever number surprises most sets the direction, with no time to parse them separately. Friday's monthly expiration matters more than usual with VIX at 14.84 and the index pinned near a record.
Major Earnings This Week
Q3 season opens. Consensus has S&P 500 Q3 earnings growth at +29.5% year over year, accelerating from +26.7% in Q2, on revenue growth of +12.3% and net margins near 15.0%. Of the first 16 companies to report, 14 beat on EPS.
Tuesday (10/13) — the banks: JPMorgan (JPM), Goldman Sachs (GS), Citigroup (C) and Wells Fargo (WFC), all before the open.
Wednesday (10/14) — Morgan Stanley (MS) and Bank of America (BAC) before the open, completing the big six. Also BNY Mellon, PNC, Charles Schwab, U.S. Bancorp and Prologis (PLD). Taiwan Semiconductor (TSM) reports as well.
Key watch: the banks as a group, for one reason — net interest margin commentary with the 30-year at a 2002 high. A steeper curve is normally a gift to bank earnings. But the same yield move that widens the spread also raises the cost of credit for every borrower on their books, and eight straight down weeks in the Russell 2000 is what a stressed small- and mid-cap borrower base looks like from the outside.
Goldman and Morgan Stanley will speak to capital markets activity and deal flow. JPMorgan, Bank of America, Wells Fargo and Citi will speak to the consumer and the commercial loan book. Listen specifically for loan-loss provisioning and any language about small-business or commercial real estate credit. If the banks are quietly building reserves while the S&P sits at a record, that is the tell that the small-cap decline is credit rather than rotation.
TSMC Wednesday is the secondary tell and the one with the broadest index read-through. It sits upstream of the entire AI complex, and with Q3 earnings expected to grow 29.5% on the back of a narrowing group of leaders, its capex and utilization commentary is the cleanest check on whether that narrow leadership has anything left.
30-Day Market Outlook
Overall bias: constructive at the index level, deteriorating underneath, and increasingly dependent on the long end of the curve. Two straight up weeks, records on Tuesday, Q3 earnings accelerating to +29.5%, and VIX at 14.84. That is a strong headline tape. The problem is everything the headline tape is hiding.
Macro narrative: Three things are true at once and they do not reconcile. The index is at a record. Fewer than a quarter of its members are above their 50-day. And the long end of the Treasury curve is at its highest yield in twenty-four years.
The reconciliation is that an increasingly small group of large, cash-rich, AI-levered companies can fund themselves at any rate and are compounding earnings near 30%, while everything that borrows — small caps, regional banks' customers, commercial real estate, consumer credit — is being squeezed by a Fed that has hiked and is telling you it may hike again.
The market has decided the Fed is bluffing. Minutes showing “most” participants expecting another increase, and a governor saying “hikes” plural on Thursday, produced sub-20% odds for October. That is not an irrational read — the Fed has talked hawkish and held repeatedly this cycle, and the long end is doing the tightening for them. But it means positioning carries essentially no protection against the alternative, and Wednesday's CPI is the scheduled test.
Eight consecutive down weeks in the Russell 2000 is the part not to dismiss as rotation. Eight weeks of one-directional decline in two thousand small companies while rates sit at a 24-year high is a credit signal, and the banks will tell us on Tuesday and Wednesday whether it is showing up in their loan books yet.
Primary risk: A hot September headline CPI on Wednesday — the +0.6% monthly, 3.6% annual print consensus already expects, or worse. It would push the 30-year back through 5.66%, reprice the October 27–28 meeting from an 82% pause toward a live hike, and hit the exact cohort that is already breaking. With VIX at 14.84 and the index eight points from a record, there is no cushion in positioning for that outcome. Watch the long end first, not the S&P.
Secondary risk: Bank credit. Six large banks report Tuesday and Wednesday into a tape where small caps have fallen for eight straight weeks. If provisioning rises or management language turns cautious on small-business or commercial credit, the narrow-leadership market loses its last argument — that the weakness underneath is rotation rather than deterioration.
Accelerant to watch: Hurricane Isaias threatening U.S. oil supply with crude already at $91.85. An energy spike feeds straight into the headline CPI number that is the week's primary risk, and hands the hawks their case without any help from the domestic economy.
Coming Up — The Flyagonal Series
I just finished a four-part series on the Flyagonal, and it starts on the channel later this week.
This is the honest version. I put the live results side by side with more than 3,000 backtested trades covering the last six years, show exactly where the two stopped lining up in April, walk through three specific mistakes I made, and lay out the rules I'm changing because of them.
- Part 1 — Did It Fail? Live results against the backtest.
- Part 2 — The Market Shifted. The April 2026 regime change.
- Part 3 — 3 Costly Mistakes. Early exits and late losers.
- Part 4 — My New Rules. Smarter exits, better execution.
Each one links to the next at the end. Start with Part 1.
Trading options involves significant risk and is not suitable for all investors. Past performance does not guarantee results. This content is educational and is not financial advice.