
Prefer to watch? Here's this weekend's video update.
The Week in Review
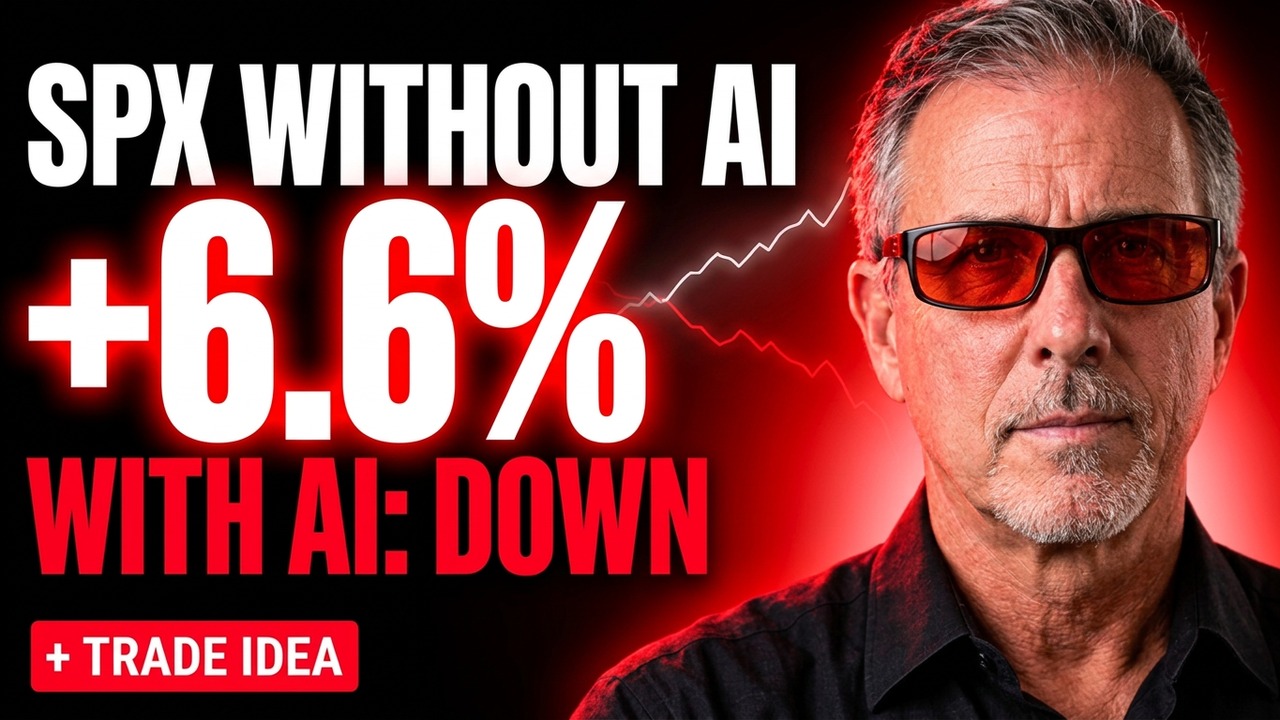
Through Thursday, the S&P 500 without its AI stocks was up about 6.6% in October. The S&P 500 with them was down roughly 0.4%. That one comparison explains the week.
SPX closed at 7,623.68, down 0.47%. It rallied into the 7,750s by Wednesday, within about 60 points of the 7,819 record close, then gave all of it back Thursday and Friday. It finished 24 points above the 7,600 level. The Nasdaq Composite fell 0.71% to 25,955.34, its second straight weekly loss. The Russell 2000 rose 2.00% to 2,775.90 — its first up week after nine straight declines.
VIX closed at 19.45 after trading as high as 20.66 on Friday. Brent crude settled at $116.72, its highest settle since April 29.
Weekly Market Scorecard — Week Ending October 23, 2026
| Index | Oct 16 Close | Oct 23 Close | Change | % Change |
|---|---|---|---|---|
| SPX | 7,659.44 | 7,623.68 | -35.76 | -0.47% ↓ |
| Nasdaq Composite | 26,140.03 | 25,955.34 | -184.69 | -0.71% ↓ |
| Russell 2000 | 2,721.37 | 2,775.90 | +54.53 | +2.00% ↑ |
Other closes: VIX 19.45, 10-year 5.00% (down from 5.09%), Brent crude $116.72 (from $109.86), WTI $103.27, gold $4,007.90 (from $4,188.10).
Meta Grew 26%. The Stock Fell 7%.
Meta reported Wednesday after the close. Revenue rose 26% to $64.6 billion, ahead of estimates, and the stock rose nearly 4% after hours. By Thursday's close it was down 7% at $648.52.
The reason is in the cash flow statement. Meta spent $34.9 billion on capital expenditures in the quarter, and free cash flow came in at negative $2.1 billion. Full-year expense guidance went up $10 billion, to $175–179 billion, much of it a $9.9 billion legal charge. Full-year capex was narrowed to $135–145 billion.
The market's first read was the revenue. The second read was the cash. The Nasdaq fell 2.6% on Thursday, and SPX lost 1.21%.
The Money Didn't Leave. It Moved.
Last week the question was what higher rates do to companies that borrow to build data centers. This week showed where the money went instead.
The S&P 500 Excluding AI index finished Thursday up about 6.6% for October, while the S&P itself was down roughly 0.4%. The Russell 2000, two thousand smaller companies that had fallen nine weeks in a row, gained 1.65% on Tuesday alone and finished the week up 2.00%.
This is not a broad rally. Nearly three of every four S&P stocks fell on Friday. But it is rotation rather than liquidation. The money is moving toward the parts of the market that do not need to finance an AI buildout.
Oil Above $116
Friday's selling came from a different direction. Houthi attacks on Saudi energy infrastructure and an oil spill off the UAE pushed Brent up 3.1% to $116.72, its highest settle since April 29 and about 6% higher on the week. WTI closed at $103.27. Oil-sensitive consumer stocks took the hit.
The 10-year still fell, to 5.00%, after dropping more than 10 basis points on Thursday. An oil spike normally pushes yields up on inflation worry. When yields fall instead, the bid is defensive — the same signal the bond market sent the week before.
SPX / SPY
7,623.68, down 0.47%. No higher high since August, and every push toward the 7,819 record close has been sold; this week's stalled in the 7,750s. Resistance at 7,700, then the 7,750s, then the 7,819 record close and the 7,844 intraday record. Support at 7,600, then 7,500. The index has not closed below 7,600. A decisive close below it would be the first lower low since August and the first real structural damage.
Nasdaq / QQQ
25,955.34, down 0.71% and about 6% below its October 6 record. Second straight weekly loss, and the 26,000 level gave way Friday. Thursday's 2.6% drop on Meta's cash flow confirms what the previous week's chip selling started: the market is now pricing what the AI buildout costs, not just what it earns.
Russell 2000 / IWM
2,775.90, up 2.00%. The nine-week losing streak is over. That deserves attention, and it is not yet a trend change. The index is still inside its downtrending channel and below the 2,808 and 2,832 closes from earlier in October. Resistance around 2,800–2,830; support near 2,721, the prior week's close.
Volatility
VIX at 19.45, slightly lower on the week, after touching 20.66 on Friday and jumping 14% on Thursday. It is holding near 20 rather than sliding back toward 14, where it sat in early October. Option premium is meaningfully richer than it was a month ago, and expected ranges are wider heading into a crowded week.
Next Week's Economic Calendar — October 26 to 30
Monday October 26 — Chicago Fed National Activity Index; Dallas Fed Manufacturing. Nothing market-moving.
Tuesday October 27 — Durable Goods (Sep), 8:30 AM ET; Case-Shiller (Aug); Conference Board Consumer Confidence (Oct), 10:00 AM ET, consensus 80.5 against 81.9 prior; New Home Sales. The FOMC meeting begins. Visa reports after the close.
Wednesday October 28 — FOMC rate decision, 2:00 PM ET. A hold at 3.75%–4.00% is expected. Microsoft (MSFT) and Alphabet (GOOGL) report after the close.
Thursday October 29 — Q3 GDP advance estimate and September PCE, both 8:30 AM ET. GDP consensus near 3.0% annualized; headline PCE expected +0.5% for the month, core PCE seen at 3.1% annual. Weekly jobless claims. Amazon (AMZN) and Intel (INTC) report after the close.
Friday October 30 — Employment Cost Index (Q3), 8:30 AM ET; Chicago PMI (Oct). Exxon Mobil and Chevron before the open.
Key watch: Wednesday. As of October 20, CME FedWatch put roughly 83% odds on a hold this week and about 94% on at least one more hike by the December 8–9 meeting. The decision is expected; the language about December is not. Microsoft and Alphabet report the same evening, and they are the two largest AI spenders left after Meta's quarter showed what happens when capex outruns cash flow. Then PCE arrives Thursday morning, after the Fed has already spoken, with Brent above $116.
Beyond the week: Apple reports Monday, November 2, and the midterm elections are Tuesday, November 3.
30-Day Market Outlook
Overall bias: cautious. The index level is holding. SPX is 24 points above 7,600 and has not made a lower low. But leadership is rotating away from the AI complex that carried the market, and the next eight days stack the Fed, three hyperscalers, an inflation print and the midterms back to back.
Macro narrative: The market stopped arguing about whether AI is real and started arguing about what it costs. Meta made the case: 26% revenue growth, negative free cash flow, $34.9 billion of capex in one quarter. The S&P ex-AI index is up about 6.6% in October while the S&P is down, and the Russell just had its first up week in ten. That is rotation, not liquidation. At the same time the inflation backdrop got worse: Brent at $116.72, the Fed already at 3.75%–4.00% after September's hike, and futures pricing better than 90% odds of another by December. The 10-year falling to 5.00% during an oil spike is the bond market choosing safety over inflation fear.
Primary risk: Wednesday, start to finish. The Fed statement at 2:00 PM, Microsoft and Alphabet after the close, PCE at 8:30 Thursday. If the Fed leans hawkish on December and either hyperscaler repeats Meta's pattern of a revenue beat with cash burn, the Nasdaq has little recent support beneath it and is already about 6% off its high.
Secondary risk: Oil. Brent rose about 6% this week on attacks on Saudi infrastructure, and there are reports that renewed U.S. action against Iran could follow the midterms. Energy runs straight into headline PCE and CPI, and headline inflation is what strengthens the case for a December hike.
What would change the read: A decisive SPX close below 7,600, the first lower low since August, would turn this from a pause into a breakdown. In the other direction, a Fed statement that leaves December genuinely open, combined with Microsoft and Alphabet showing cash flow holding up against capex, would let the AI complex stabilize and put the 7,819 record back in play.
Trading options involves significant risk and is not suitable for all investors. Past performance does not guarantee results. This content is educational and is not financial advice.