.png)
Prefer to watch? Here's this weekend's video update.
Note: this week's video includes a Flyagonal segment about seven and a half minutes in — a walk through the backtest covering 2020 to the present, with the live results plotted against it. If you have been following the drawdown discussion over recent weeks, that segment is worth the watch.
The Week in Review
This was a week where the economic data and the bond market reached opposite conclusions, and the stock market picked a side.
Thursday the 10-year Treasury yield reached 5.34%, its highest level since 2002. The 30-year crossed 5.6%, also a 24-year high. Global sovereign yields set fresh cycle highs alongside — France, Italy, Germany, Japan and the UK all made new highs the same week. The 10-year has risen roughly 50 basis points in a single month.
Friday the labor market cracked. September nonfarm payrolls came in at 29,000 against expectations near 85,000. The unemployment rate rose to 4.2%. July and August were revised down by a combined 60,000 jobs, with August cut from 162,000 to 133,000. The three-month average is now 50,000 — roughly a third of what August originally appeared to be.
It wasn't uniformly weak. The household survey showed a gain of 406,000 and the participation rate rose to 61.8%, which is a sign of people entering rather than leaving the workforce. And the broader data was firm: real consumer spending rose 0.6% in August against 0.5% expected, and second-quarter real GDP was revised up to 2.2% from 1.5%.
Combined with Wednesday's PCE — headline at 3.4% and core at 3.0%, both three tenths below forecast — the week delivered everything a dovish case requires. October hike odds fell from 64.2% to 22.1%. No cut got priced. Two senior Fed officials signaled publicly that they wanted more data, which markets read as support for a pause.
Equities responded. Friday brought the Dow up 250 points, the S&P up 0.74%, the Nasdaq up 1.19%, and the Nasdaq Composite closing at a record 27,190.86 with NVDA touching an all-time high.
But the long end didn't cooperate. The 2-year fell about 5 basis points on the week to 4.84% — the Fed-sensitive part of the curve did exactly what you'd expect. The 10-year rose 7bp and the 30-year rose 13bp. The curve steepened sharply. Translated: the market accepts the Fed may stop hiking, and separately does not want to fund the government at these yields. That's a fiscal and supply problem, not a monetary one, and the Fed can't fix it by pausing.
Weekly Market Scorecard — Week Ending October 2, 2026
| Index / ETF | Weekly % Change | Friday Close |
|---|---|---|
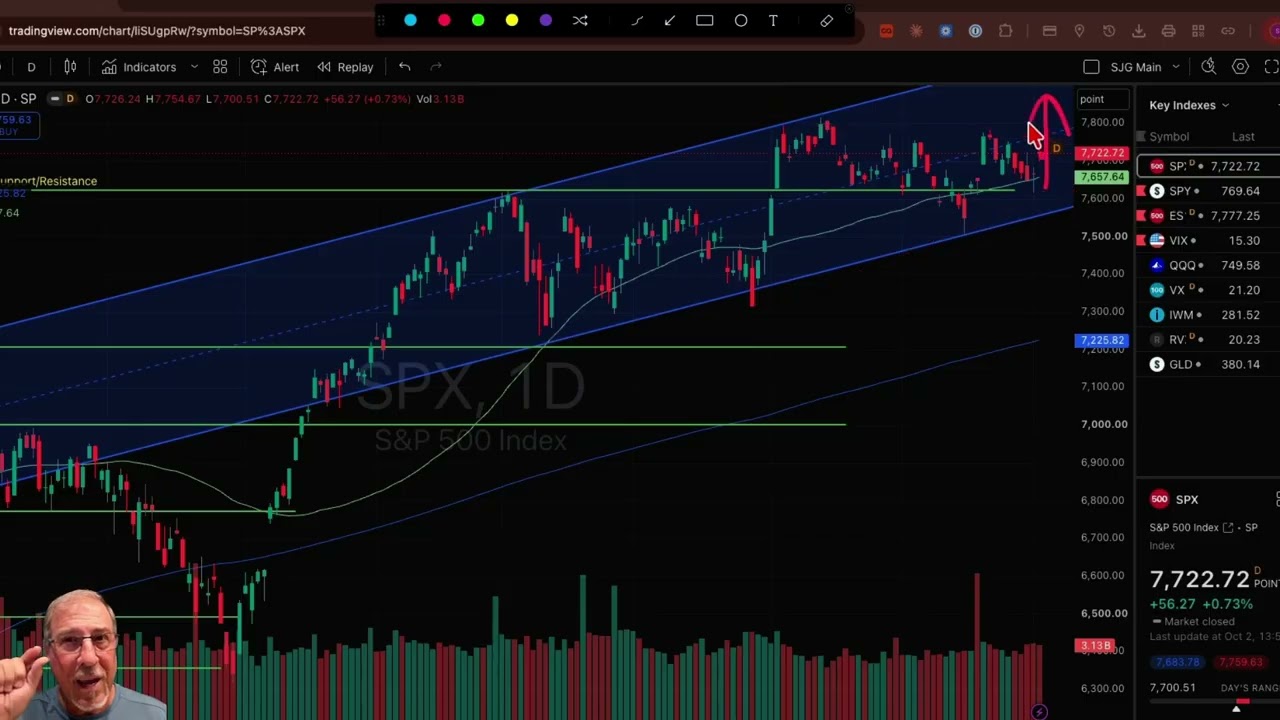
| SPX | -0.27% | 7,722.72 |
| QQQ | +0.68% | — |
| IWM | -0.16% | — |
ETF percentages are actual weekly moves. Index closes: S&P 500 7,722.72 (-20.69); Nasdaq Composite 27,190.86 (+122.15, a record close); Dow 51,176.96 (-651.66, -1.26%); Russell 2000 2,832.89 (-4.67). Year to date: Nasdaq +16.99%, Russell 2000 +14.14%, S&P 500 +12.81%, Dow +6.48%. VIX 15.40. Yields: 1-year 4.46%, 2-year 4.84%, 5-year 5.06%, 10-year 5.28%, 30-year 5.61%. WTI crude around $89.41, Brent above $102.
Breadth Is Washing Out
The Nasdaq set a record. Underneath it, only 24.7% of S&P 500 members sit above their 50-day moving average, down from 27.4% a week earlier. Just 45.7% are above their 200-day. New lows outnumbered new highs in every session. The equal-weighted S&P fell 0.7% while the cap-weighted index fell 0.27% and the Nasdaq hit a record. A quarter of the index is carrying the whole thing.
And the valuation math has crossed a line worth naming. The forward equity risk premium — the S&P's forward earnings yield minus the 10-year yield — is now negative 7 basis points. Stocks yield less than Treasuries. Wells Fargo's Ohsung Kwon notes equities now make up roughly 72% of investor portfolios, the highest share since 1969, at the exact moment they stopped offering a premium over risk-free bonds. Stock-bond correlation sits in its 92nd percentile, which means Treasuries are not currently working as a hedge either.
SPX / SPY
SPX closed at 7,722.72, about 1% below its August record. Resistance: 7,750, then the record at 7,798.99 from August 13, then 7,850 and 8,000. Support: 7,700, then 7,650, then the 50-day near 7,615, then 7,570–7,580. Breadth is the number to watch here, not price — a record index on a quarter of its components is a fragile structure.
QQQ
Up 0.68% on the week — the only one of the three in the green. The Nasdaq Composite's record close and NVDA's all-time high tell you where the money went. Large-cap technology with cash on the balance sheet is the one group a 5.28% ten-year does not punish.
IWM
Down 0.16%, with the Russell 2000 at 2,832.89. Still up 14.14% year to date, but it has been the weak flank for weeks. Small caps need cheap financing, and the long end just told them it isn't coming.
Next Week's Economic Calendar — October 5 to 9
Monday October 5 — ISM Services PMI (Sep), 10:00 AM ET; S&P Global Services PMI final, 9:45 AM ET.
Tuesday October 6 — Trade Balance (Aug); Treasury auction activity begins.
Wednesday October 7 — FOMC Minutes from the September 15–16 meeting, 2:00 PM ET; MBA Mortgage Applications; EIA inventories.
Thursday October 8 — Initial jobless claims (week ending Oct 3), 8:30 AM ET; Wholesale Inventories.
Friday October 9 — University of Michigan Consumer Sentiment, preliminary (Oct), 10:00 AM ET, with 1-year and 5-year inflation expectations.
Key watch: Wednesday's minutes, and the framing matters. October is now 78% priced for a hold, so the minutes aren't about this month's decision — they're the internal record of the meeting where the committee hiked, removed all expected easing through 2027, and had 16 of 18 officials projecting at least one more increase. The question the minutes answer is whether that hawkish consensus was broad or thin, and what conditions members named for moving again.
The quieter but possibly more important item is Treasury supply. Several auctions land into yields at multi-decade highs, two weeks after the 5-year produced the second-largest tail on record. Watch bid-to-cover and whether anything tails. The long end rising on a week of uniformly dovish data tells you demand is the binding constraint, not Fed policy — and another weak auction confirms it.
Friday's Michigan sentiment carries weight for a different reason. September's preliminary reading was 47.8, the second-lowest on record. If October confirms that level while payrolls run at 29,000, the consumer story and the labor story are converging.
Major Earnings This Week
A genuinely quiet week — the calendar between quarters. Q3 reporting season begins the following week when the large banks open the cycle.
What's worth watching instead is the AI capex complex, which has carried the index to its record while 75% of the S&P sits below its 50-day. NVDA touched an all-time high Friday. With long yields at 24-year highs and that buildout financed increasingly with corporate debt, the cost side of that trade is rising even as the demand side holds.
Key watch: in the absence of earnings, positioning around Wednesday's minutes and the Treasury auctions will drive the tape. A light earnings calendar tends to amplify index-level moves, because there's no company-specific news to absorb flows.
30-Day Market Outlook
Overall bias: Neutral on the index, actively negative on breadth, and the valuation math has turned hostile. The S&P at 7,722.72 is about 1% below its August record and up 12.81% on the year. The Nasdaq closed at a record. Both of those facts are true while three quarters of the S&P trades below its 50-day moving average.
Macro narrative: Something changed this week that is worth understanding carefully, because it is not intuitive. Every piece of economic news was dovish — weak payrolls, cool PCE, officials signalling patience — and hike odds fell by two thirds. On the old playbook, long yields should have fallen hard. They rose instead.
The reason is that the long end is no longer trading primarily on Fed policy. It's trading on supply, fiscal deficits, AI-related corporate debt issuance competing for the same buyers, and a global repricing happening simultaneously across France, Italy, Germany, Japan and the UK. A Fed pause doesn't address any of that. This is the distinction between the price of money the Fed sets and the price the market demands for duration — and right now they are moving in opposite directions.
That has a direct consequence for equity valuation. With the S&P's forward earnings yield now below the 10-year, the premium investors have historically earned for taking equity risk has disappeared. That doesn't mean stocks fall tomorrow. It does mean the cushion is gone, and it explains why the index can only advance on a handful of names with cash-rich balance sheets while the median stock bleeds.
Primary risk: Another weak Treasury auction. The 10-year rose on a week of dovish data, which says demand is the constraint. If an auction tails the way the 5-year did two weeks ago, the 10-year clears 5.35% and heads toward 5.50%, and at roughly -2% of multiple per 10bp, that's a meaningful hit to a market with no risk premium left.
Secondary risk: Breadth. A record index carried by a quarter of its members is vulnerable to any stumble in the leadership group. NVDA at an all-time high with long yields at 24-year highs is a narrow place for the whole market to be standing.
What would change the picture: Strong auction demand pulling the 10-year back under 5.00%, which would restore a positive equity risk premium and most benefit the 75% of the index that's been left behind — small caps and the median S&P stock. Watch the 30-year specifically; it rose the most this week and it's the purest read on whether this is about supply or about the Fed.