.png)
Prefer to watch? Here's this weekend's video update.
The Week in Review
This was a week about energy and financing costs, and the Fed was almost a side plot.
Monday through Thursday the S&P fell four consecutive sessions, shedding roughly 2% and landing about 3% below its August record. Two forces did it. Brent crude crossed $100 on Tuesday, passed $101 Wednesday, and surged more than 6% Thursday to trade above $108 before settling near $107.63 — driven by a Wall Street Journal report that senior White House advisers have privately told the President the Iran conflict may continue through the rest of his term. Crude has now roughly doubled since early July.
At the same time Treasury yields set fresh 52-week highs, with the 10-year climbing toward 5% and the 2-year reaching about 4.65%, its highest in two years. That combination hits technology hardest — higher discount rates compress the present value of distant earnings, and the AI buildout is being financed with borrowed money at exactly the moment borrowing got more expensive.
Thursday's PPI came in slightly hotter than expected and sank the tape further. Oracle reported after the close that evening. Its remaining performance obligation — the contracted backlog that has become the market's proxy for AI demand — reached $638 billion, up 363% year over year. The counterweight is that Oracle burned roughly $24 billion in negative free cash flow in fiscal 2026 on $55.7 billion of capex, with fiscal 2027 capex guided to $70–95 billion and about $40 billion of planned debt and equity raises. The results beat, and that was enough to bounce the AI complex Friday.
Then Friday's CPI. Headline consumer prices rose 0.4% for the month and 3.4% year over year — precisely what economists forecast, and unchanged from July. Core prices rose 0.3% against the 0.2% consensus, a genuine upside surprise, while the annual core rate eased to 2.4% from 2.5%, the lowest since March 2021.
Markets rallied on it. Dow +0.98%, Nasdaq +0.96%, S&P +0.86%, VIX down more than 11%. That looks contradictory until you consider what the week had already priced. Investors had spent four sessions absorbing $108 oil and a 10-year near 5%, braced for a genuine inflation shock. They didn't get one. Oil also backed off about 3% Friday on reports of potential diplomatic talks over the Strait of Hormuz, and the 10-year eased. Sometimes the market doesn't need good news — it needs the news to be less bad than feared.
The Fed did not get an all-clear. Odds of a 25 basis point hike on Wednesday rose to roughly 85–90%, from about 70% before the print and near 50% a week ago. Michigan's preliminary September sentiment reading of 47.8 missed badly while one-year inflation expectations rose to 4.6% — soft confidence alongside rising expected inflation, which is the pairing central bankers least want to see.
Perspective is worth keeping: the S&P remains up roughly 11% for 2026 and the Nasdaq more than 12%. This is a repricing of the macro environment, not a breakdown in earnings.
Weekly Market Scorecard — Week Ending September 11, 2026
| Index | Sep 4 Close | Sep 11 Close | Change | % Change |
|---|---|---|---|---|
| SPX | 7,721.21 | 7,656.98 | -64.23 | -0.83% ↓ |
| QQQ | ~722.3 | ~717.6 | ~-4.7 | ~-0.65% ↓ |
| IWM | ~295.7 | ~288.7 | ~-7.0 | ~-2.36% ↓ |
QQQ and IWM are derived from their underlying indexes, which are exact: Nasdaq Composite 26,504.24 → 26,333.04 (-0.65%); Russell 2000 2,974.25 → 2,903.94 (-2.36%). Other closes: Dow 52,573.29 (-1.58%, worst week since March), VIX 15.84, WTI crude $100.13 (+10% on the week), gold around $4,390–4,409, 2-year ~4.65%, 10-year approaching 5%.
SPX / SPY
SPX closed at 7,656.98, roughly 3% below its August record. Support is 7,650 and the index is sitting on it, then 7,635, then 7,591 (Thursday's close and the week's low zone), then 7,570–7,580, with the 50-day near 7,500. Resistance: 7,700 first — it needs to be reclaimed before anything else matters — then 7,747, then the record zone at 7,799–7,816.
Volatility (VIX)
VIX at 15.84, up from 13.95 but still historically low. It fell 11% Friday into an FOMC week where a hike is 90% priced. That is not the positioning of a market braced for a hawkish dot plot.
QQQ
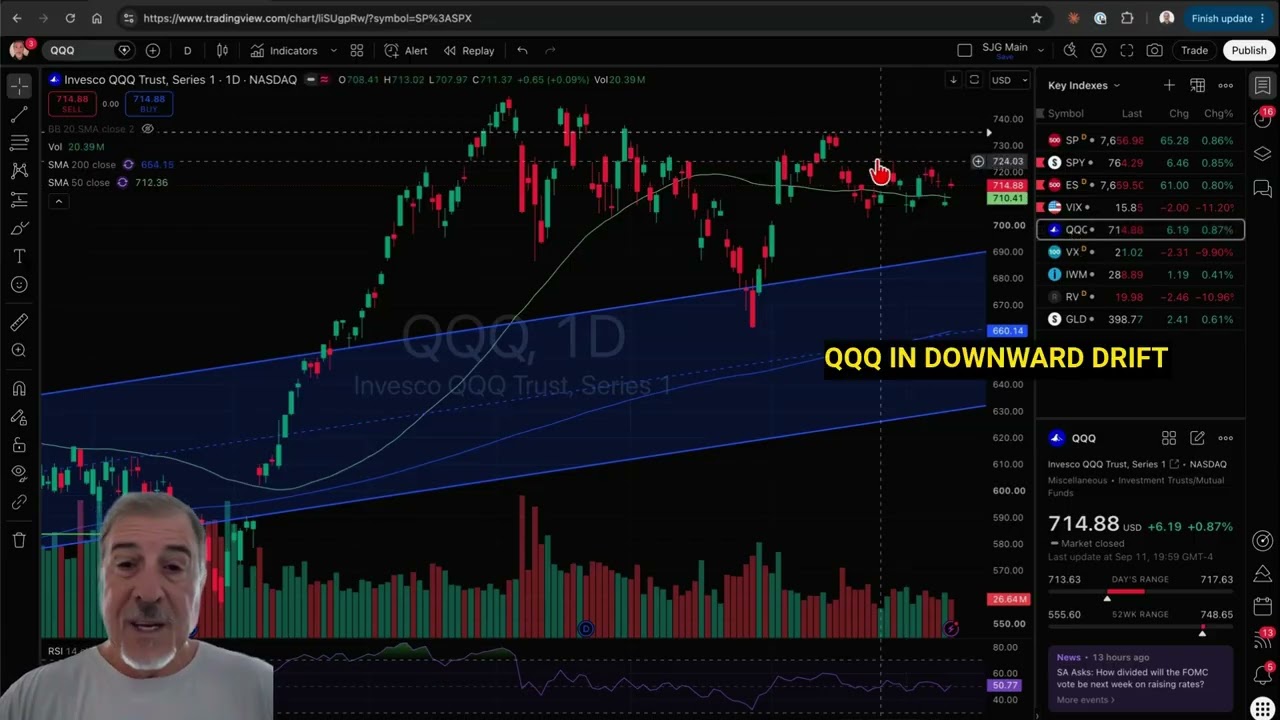
Around 717.6, down roughly 0.65%, with the Nasdaq Composite at 26,333.04. Support at 710, then 700. Tech held up better than small caps because large-cap growth carries durable earnings and cash rather than floating-rate debt, but it remains the group most exposed to a 10-year near 5%.
IWM
Around 288.7, down roughly 2.36%, with the Russell 2000 at 2,903.94 — the weakest major index on the week and further below 3,000. Small caps carry the most floating-rate debt, so a higher-for-longer path hits them first and hardest. They also have the most to gain if Wednesday's projections come in softer than feared.
Next Week's Economic Calendar — September 14 to 18
Monday September 14 — No major U.S. economic data. Goldman Sachs Global Retailing Conference begins.
Tuesday September 15 — ADP Weekly Employment Change, 8:15 AM ET; Empire State Manufacturing Index (Sep), 8:30 AM ET; Treasury sells $18B in 20-year notes. FOMC two-day meeting begins.
Wednesday September 16 — Import and Export Price Indexes (Aug), 8:30 AM ET; Retail Sales (Aug) and ex-Autos, 8:30 AM ET; Business Inventories (Jul) and NAHB Housing Market Index (Sep), 10:00 AM ET; FOMC rate decision AND Summary of Economic Projections, 2:00 PM ET.
Thursday September 17 — Initial jobless claims and Philadelphia Fed Manufacturing Index (Sep), 8:30 AM ET; FOMC press conference.
Friday September 18 — Quarterly options expiration.
Key watch: Wednesday at 2:00 PM, but not for the reason most coverage will suggest. The hike is roughly 85–90% priced. A 25 basis point increase is close to fully discounted, which means the decision itself carries limited surprise value in either direction.
What is not priced is the path. This release includes the Summary of Economic Projections — the dot plot — and it is the first of Kevin Warsh's chairmanship. He has dismantled forward guidance as a communication tool, which makes the dots the only structured signal available about where the committee thinks rates are headed. If they show a sustained hiking path rather than a one-and-done risk-management move, the front end reprices again and small caps take the brunt.
Retail Sales at 8:30 that same morning is the underrated release. It lands six hours before the decision, and with Michigan sentiment at 47.8 and one-year inflation expectations at 4.6%, it is the cleanest available read on whether households are actually cutting back or merely feeling gloomy about gas prices. A weak print alongside a hawkish dot plot would be the most difficult combination for equities.
And note Friday: quarterly expiration means unusually heavy volume, gamma effects around large open-interest strikes, and price behavior that can look disconnected from news. Two days after an FOMC decision, that is worth knowing in advance.
Major Earnings This Week
A genuinely light week. The earnings calendar has faded almost entirely and the Fed owns the attention.
Wednesday — Lennar (LEN) after the close. Friday — VinFast (VFS). Smaller reporters fill the rest.
Key watch: Lennar Wednesday, and the timing is unusually good — it reports hours after the Fed decision, on the same day as Retail Sales and the NAHB Housing Market Index. Homebuilders are the most directly rate-sensitive group in the market, and with the 10-year flirting with 5%, mortgage rates are at levels that materially change buyer affordability. Lennar's order rate, cancellation rate, and incentive commentary will tell you more about how restrictive policy actually feels on the ground than any Fed statement will.
30-Day Market Outlook
Overall bias: Cautious into Wednesday, with the real risk in the dot plot rather than the decision. The S&P sits at 7,656.98, roughly 3% below its August record, having given back ground for the first time in a month. The uptrend is intact — the index is still up about 11% on the year — but two of its supports have weakened simultaneously.
Macro narrative: The market's problem has changed shape. Through August the question was whether inflation would decline enough to keep the Fed parked. That question is settled — core CPI ran hot, PPI ran hot, and the Fed is going to move. The question now is how far.
Three things are pulling in the same direction, which is what makes this uncomfortable. Oil has roughly doubled since early July on a conflict with no visible end date, and it feeds headline inflation with a lag, meaning even benign August data doesn't clear September and October. Long yields near 5% raise the cost of financing the AI capital cycle at exactly the moment that cycle requires the most capital — Oracle alone is guiding to $70–95 billion of capex against negative free cash flow. And consumer confidence at 47.8 with inflation expectations at 4.6% suggests households are absorbing the energy shock directly.
Against that, earnings are holding, the economy is not in recession, and the S&P is up 11% on the year. This is a valuation and discount-rate problem, not an earnings problem. But discount-rate problems are precisely what compress multiples, and the groups that have led are the two most exposed.
Primary risk: A hawkish dot plot Wednesday showing a sustained hiking path rather than a single risk-management move. With the hike itself 85–90% priced and VIX at 15.84, the market has hedged the event but not the trajectory. A projection implying three or four more hikes into 2027 would send the 2-year through 4.75%, push the 10-year decisively above 5%, and hit small caps and unprofitable growth hardest.
Secondary risk: Oil. Friday's 3% pullback came on reports of possible Strait of Hormuz diplomacy — a headline, not an agreement. If talks stall and Brent resumes its climb toward $110 and beyond, headline inflation stays elevated regardless of what core does, and the Fed's hiking path extends independent of domestic demand.
What would change the picture: A dovish dot plot framing Wednesday's hike as insurance rather than the start of a cycle, paired with genuine progress on Hormuz. That combination pulls the long end back below 4.75%, and the groups that have been punished most — small caps and the AI complex — would rebound hardest. Watch the 10-year: a decisive move back under 4.75% would be the first real signal that the macro pressure is easing.